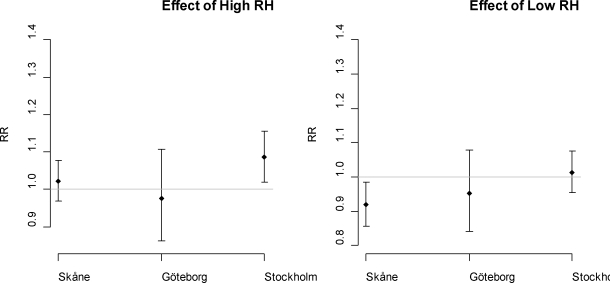
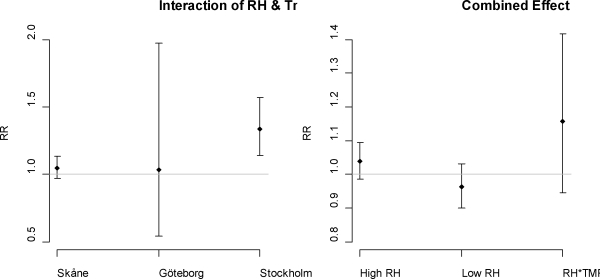
Figure 3.
Above; the relative risks of daily relative humidity (lag 0) in categories high (above mean) and low per each 20 units increase of relative humidity in the three study regions. Below at left; effect modification of temperatures above 90th percentile and relative humidity above 80th percentile as indicator variable in the three study regions. Below right; the combined relative risk of relative humidity (for a 20 unit increase) and the combined relative risk of the effect modification with temperature (temperature above 90th percentile and relative humidity above 80th percentile). The vertical lines represent the 95% confidence width. The horizontal line marks relative risk =1.


