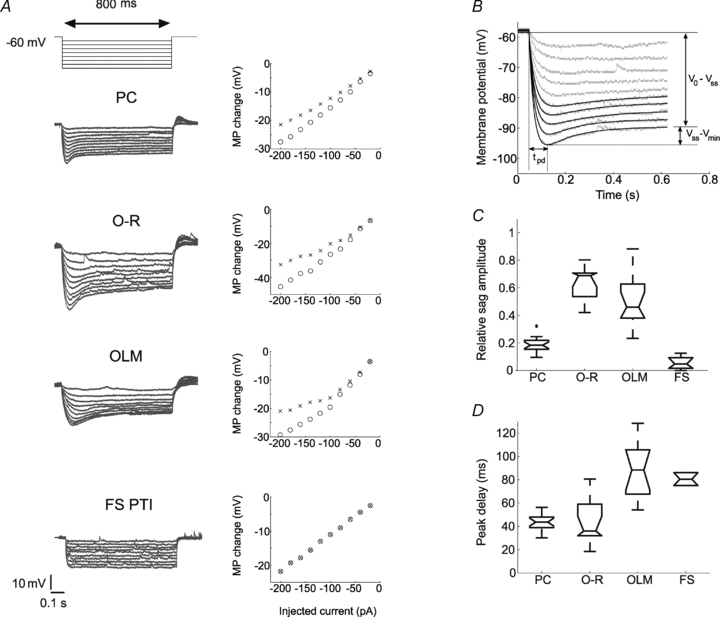
Figure 2. Properties of the sag in the investigated cell types.

A, representative voltage responses of the investigated cell types to hyperpolarising current pulses (800 ms long steps from −20 to −200 pA, at 20 pA intervals from a holding potential of −60 mV), and the corresponding I–V plots of the peak (open circles) and the steady state membrane potential (MP) changes of the same cells (crosses). B, sag parameters were determined from the voltage response of the cell to the five largest amplitudes of the negative current steps (from −120 pA to −200 pA, in 20 pA steps). Relative sag amplitude is the ratio of the difference between the steady state voltage at the end of the pulse and the minimum voltage during the sag (Vss–Vmin), and the difference between the holding potential and the steady-state voltage (Vo–Vss). The holding potential was approximately −60 mV in each cell. The peak delay (tpd) was defined as the time of the negative peak of the membrane potential relative to the beginning of the current pulse. C and D, relative sag amplitudes and peak delays in the different cell types. Note that PCs (n= 19) displayed small but rather fast sag, O-R cells (n= 11) had a large and fast sag, while OLM cells (n= 12) usually showed a rather large but relatively slow sag. Two out of seven FS PTIs also showed a sag but it was rather small and could be observed only at membrane potentials negative to −90 mV.
