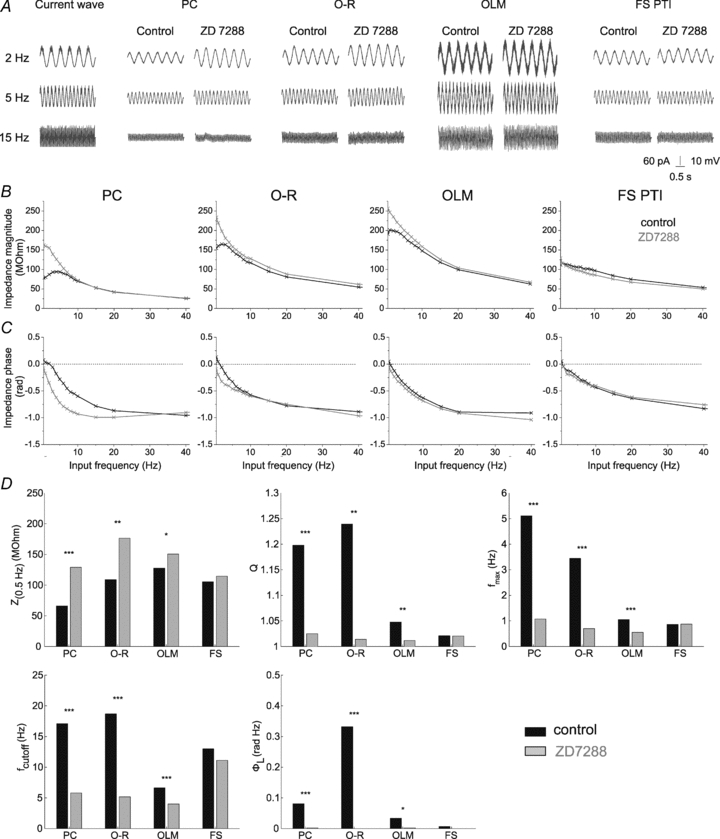
Figure 4. The effect of blocking Ih on the impedance profile of the investigated cell types.

A, voltage responses of representative cells of the investigated cell types to 3 s long sinusoidal current inputs at 2, 5 and 15 Hz at a holding potential of −80 mV under control conditions and in the presence of the Ih-blocker ZD7288 (10 μm). B and C, the magnitude and phase of the impedance as a function of input frequency of the same cells measured at −80 mV in control conditions (black) and in the presence of 10 μm ZD7288 (grey). Note that after blocking Ih both the magnitude and the phase profiles changed substantially in PCs, O-R cells and OLM cells; however, ZD7288 had no apparent effect on the shape of the impedance profiles in FS PTIs. D, statistical comparison of the five investigated parameters in the different cell types under control conditions and in the presence of 10 μm ZD7288. Since ZD7288 had a similar effect at all investigated membrane potentials, data measured at different potentials were pooled in this figure. Note that ZD7288 significantly changed all properties of the impedance curves in cell types expressing a sag, but had no significant effect in FS PTIs. *P < 0.05; **P < 0.01; ***P < 0.001. (See also Table 3.)
