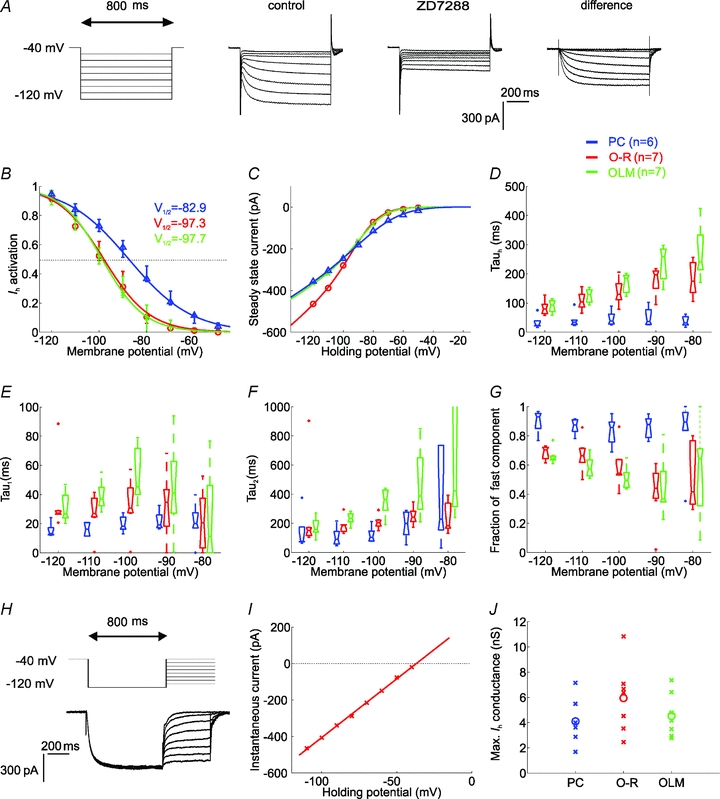
Figure 5. The properties of Ih in the different cell types.

A, Ih was elicited by 800 ms-long hyperpolarising voltage steps from a holding potential of −40 mV to the range of −50 to −120 mV, in 10 mV steps. Current traces recorded before and after the application of 10 μm ZD7288. The ZD7288-sensitive current was obtained by digital subtraction. B, the activation curves of Ih in the investigated cell types, calculated from tail current amplitudes. C, the current–voltage (I–V) relation of Ih in the different cell types obtained by plotting steady-state currents. Note that at physiologically relevant potentials (positive to −90 mV), a significantly larger amplitude of Ih was activated in PCs than in interneurons. D, the activation kinetics (Tauh) of Ih plotted against membrane potential for PCs, O-R cells and OLM cells obtained from single exponential fits. The time course of activation was generally more rapid in PCs than in interneurons over the entire voltage range. E and F, two components of the activation kinetics could be clearly identified with double exponential fits in all cell types. Fast (Tau1, E) and slow time constant (Tau2, F) of Ih activation as a function of voltage for PCs, O-R cells and OLM cells. In each cell type the fast time constant was about 5–8 times more rapid than the slow time constant of activation at a given potential. G, the fraction of the fast exponential component (Tau1) as a function of voltage. Note that in PCs the fraction of Tau1 was predominant over the entire voltage range, while in interneurons the fast component becomes predominant only at hyperpolarised potentials (below −100 mV) but even at −120 mV it represents only 70% of the total current amplitude. H, to determine the reversal potential of the current, Ih was fully activated with a voltage pulse to −120 mV and this was followed by steps to different test potentials (from −110 mV to −40 mV in 10 mV increments). I, the open-channel I–V plot was constructed from the tail current amplitudes measured at each test potential and the reversal potential of Ih was extrapolated from these plots. J, the estimated maximal conductance values of Ih for each cell of the different cell types (crosses). Circles indicate median values. There was no significant difference in the maximal conductance of Ih between the investigated cell types. In all plots PCs are shown in blue, O-R cells in red and OLM cells in green.
