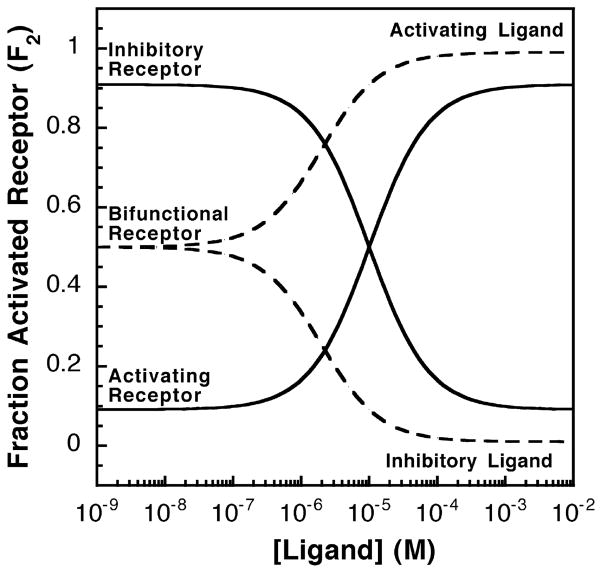
Figure 2.
Activating or inhibitory receptor systems and the effects of increasing activating or inhibitory ligand concentrations. Shown in continuous lines are the relative receptor-regulated activities of activating and inhibitory receptors over varying ligand concentrations. The homogeneous two-state model was used and the fraction of receptors in the activated state was calculated as described in the text (see equation (4)). The activating receptor shown has a low K12 value (K12 = 0.1) such that less than 10% of the receptor population is in the on-state in the absence of ligand. For this activating receptor, the activating ligand has a higher affinity for the on-state (KD2 = 1 μM) than for the off-state (KD1 = 100 μM), thus the binding of activating ligand to the activating receptor biases the receptor toward the on-state (state 2). In contrast, the inhibitory receptor shown has a high K12 value (K12 = 10) such that over 90% of the receptor population is in the on-state in the absence of ligand. The inhibitory ligand has a higher affinity for the off-state (KD1 = 1 μM) than for the on-state (KD2 = 100 μM), thus binding of the inactivating ligand to the the inhibitory receptor shifts the equilibrium toward the off-state (state 1). Finally, the broken lines indicate a bifunctional receptor with an intermediate K12 value (K12 = 1.0), indicating that the receptor populations of the on-state and the off-state are equal in the absence of ligand. This bifunctional receptor has two sets of dissociation constants for activating (KD1 = 100 μM, KD2 = 1 μM) and inhibitory ligands (KD1 = 1 μM, KD2 = 100 μM).

