
Fig. 1.
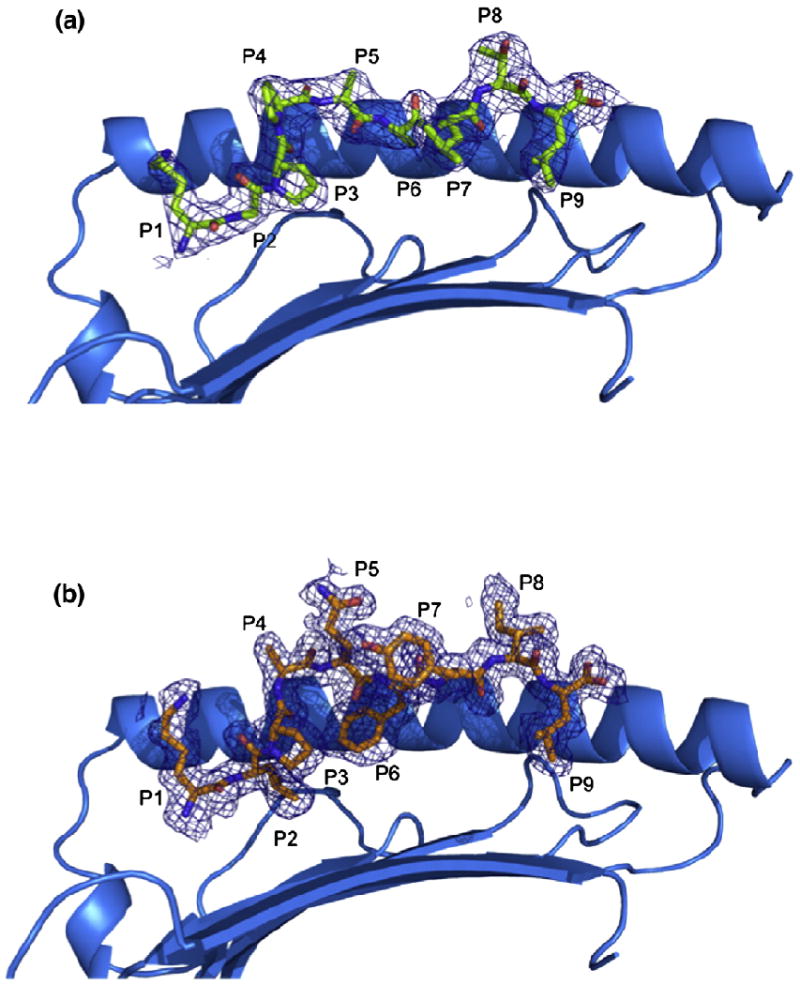
Structure of pHLA-G complexes. (a and b) Side views of the HLA-GKGPPAALTL complex (a) and the HLA-GKLPAQFYIL complex (b) showing 2.4- and 1.7-Å omit maps, respectively (contoured at 1σ). The α2 helix has been removed for clarity.
Official websites use .gov
A
.gov website belongs to an official
government organization in the United States.
Secure .gov websites use HTTPS
A lock (
) or https:// means you've safely
connected to the .gov website. Share sensitive
information only on official, secure websites.
Structure of pHLA-G complexes. (a and b) Side views of the HLA-GKGPPAALTL complex (a) and the HLA-GKLPAQFYIL complex (b) showing 2.4- and 1.7-Å omit maps, respectively (contoured at 1σ). The α2 helix has been removed for clarity.