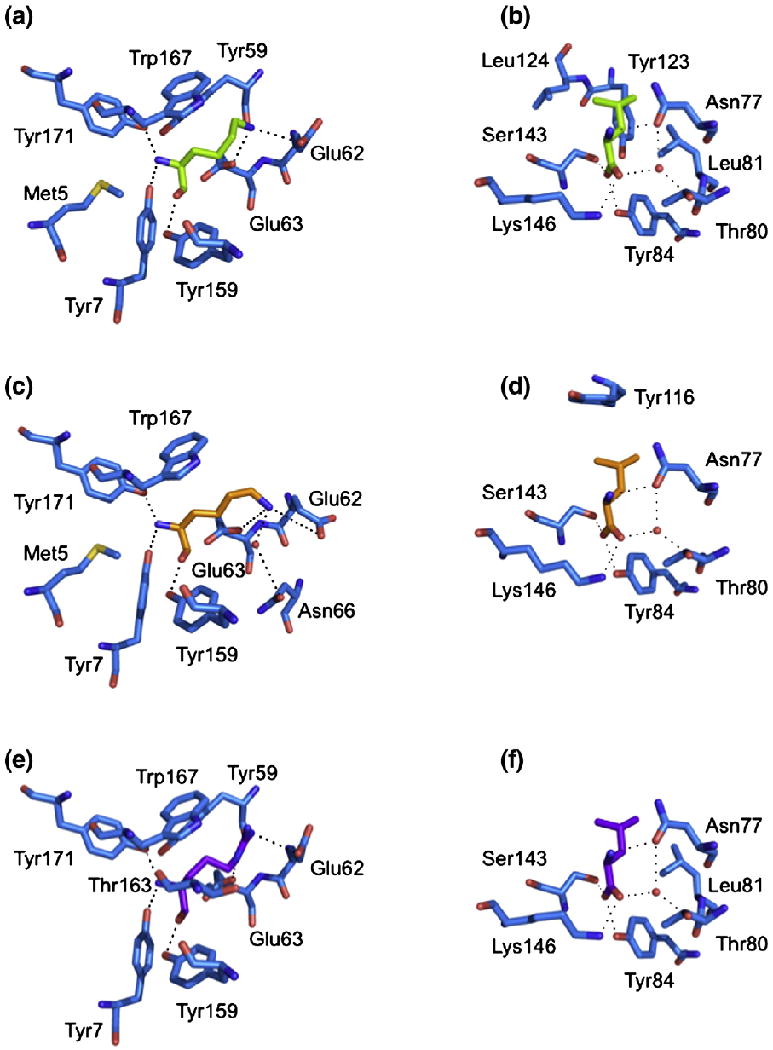
Fig. 2.

Conserved interactions between peptide and HLA-G. The polar and non-polar contacts of the P1 residue (a, c, e) and the P9 residue (b, d, f) of each pHLA-G complex are shown. (a and b) HLA-GKGPPAALTL. (c and d) HLA-GKLPAQFYIL. (e and f) HLA-GRIIPRHLQL. H-bonds and salt bridges are represented by dashed lines, and water molecules are represented by red spheres.
