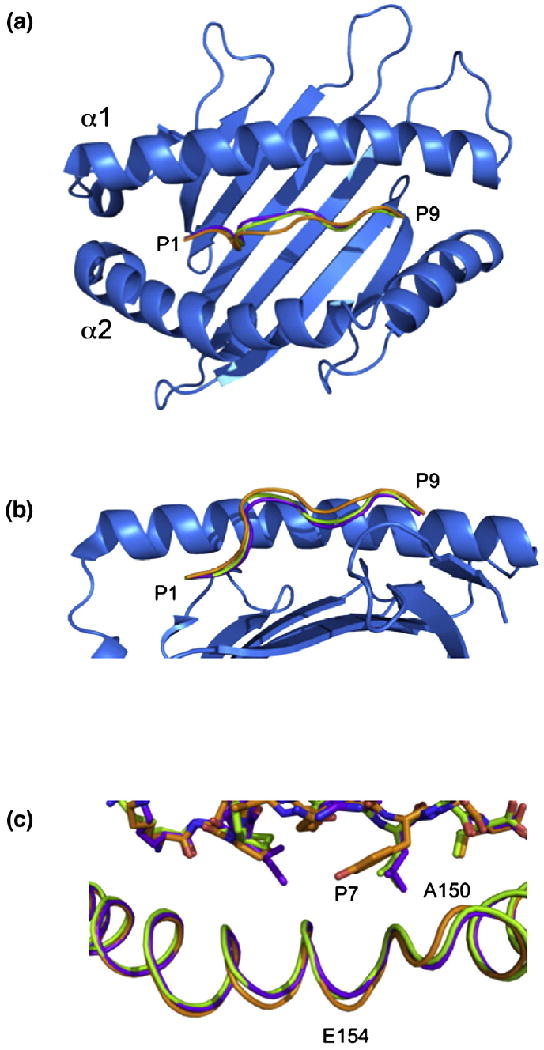
Fig. 5.

Comparison of the three pHLA-G complexes. Top view (a) and side view (b) of HLA-G showing the backbones of RIIPRHLQL (purple), KGPPAALTL (green) and KLPAQFYIL (orange). The α2 helix has been removed from (b) for clarity. (c) A 0.9-Å shift in the α2 helix centered at V152 is seen in the HLA-GKLPAQFYIL complex (orange) when compared with HLA-GRIIPRHLQL (purple) and HLA-GKGPPAALTL (green).
