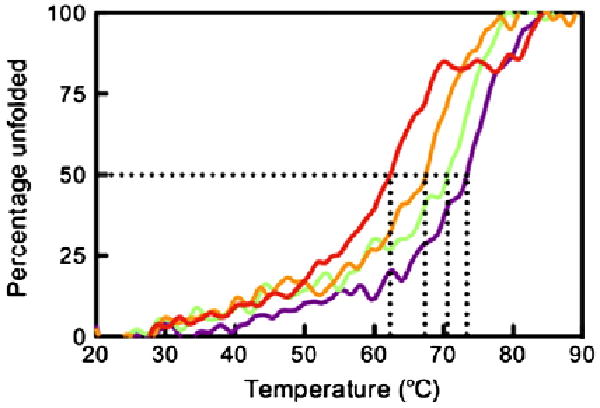
Fig. 7.

Thermal stability of pHLA-G complexes. The ellipticity at 218 nm was measured as temperature increased from 20 to 90 °C. The data were normalised to determine the midpoint of thermal denaturation (Tm). Samples were diluted to 5 and 10 μM in 10 mM Tris, pH 8.0, containing 150 mM NaCl. The complexes were measured twice at both 5 and 10 μM, and the Tm was averaged over the four experiments. The figure is representative of denaturation at 5 μM. Data for HLA-GRLPKDFRIL, HLA-GKLPAQFYIL, HLA-GKGPPAALTL and HLA-GRIIPRHLQL are shown in red, orange, green and purple, respectively.
