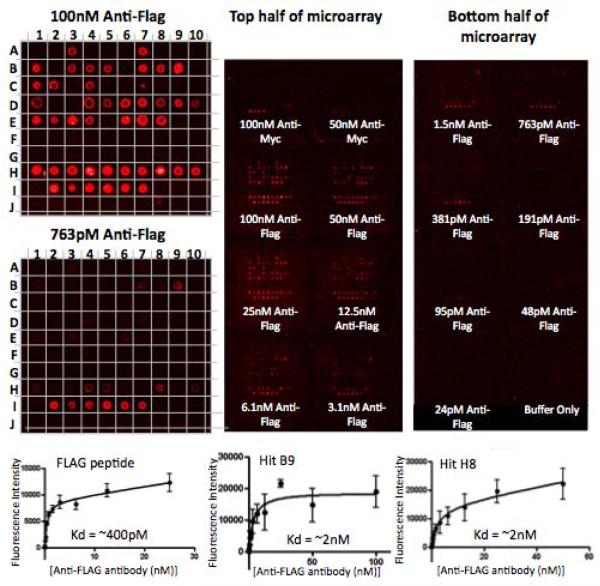
Figure 3. Microarray-based analysis of the hits isolated in the magnet-assisted screening procedure.
16 replicate arrays of hit compounds as well as positive and negative controls were spotted onto each of three microarray slides and hybridized with anti-Myc antibody or decreasing concentrations of anti-FLAG antibody, followed by red fluorescently labeled secondary antibodies. Displayed is the image of one of the three slides (right), with the 100 nM and 763 pM anti-FLAG antibody hybridized portions of the slide magnified (left). Anti-Myc antibody only binds Myc peptide, while anti-FLAG antibody binds FLAG peptide as well as many of the hits, but not the negative controls. The binding curves for FLAG peptide and two of the best hits are shown on the bottom. A1–E8, G10–I1 = Hits from X-X-X-X-X-X-Nffa-Met library screen, E9–G9 = Negatives from the screen, I2–I7 = FLAG peptide, I9–J4 = Myc peptide, I8, J5–J10 = blank. See Table 1 for sequences and binding affinities.

