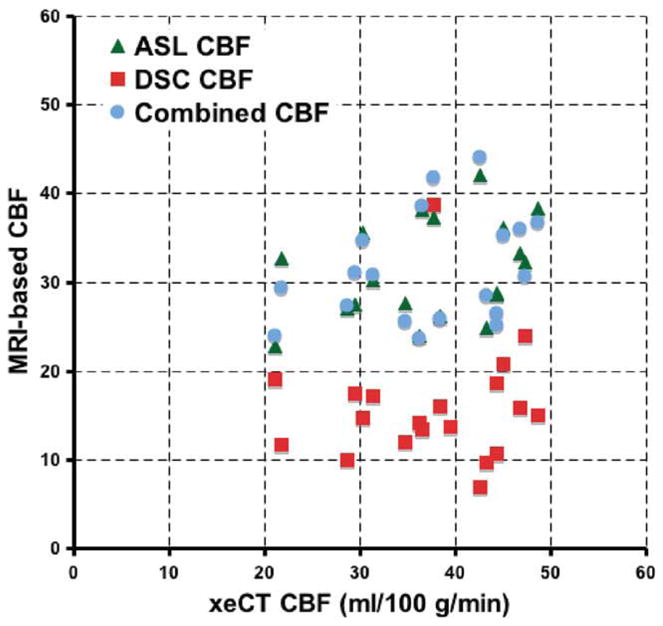
FIG. 4.

Comparison of ASL, uncorrected DSC, and CAD mean global CBF compared with gold-standard xeCT CBF. Data points shown are mean CBF values, which include all imaged tissue, and are a mixture of gray and white matter for each patient. Note the improved bias in the measurement of the ASL and CAD CBF methods compared with the uncorrected perfusion-weighted image method. The correlation of both the ASL and the CAD CBF maps was 0.23 (P < 0.05), while the correlation of the uncorrected DSC CBF images was 0.04 (P = non-significant). [Color figure can be viewed in the online issue, which is available at www.interscience.wiley.com.]
