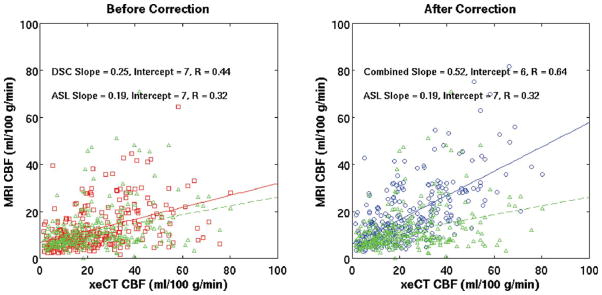
FIG. 5.
Comparison of correlation between the MRI techniques and xeCT CBF in regions with long arterial arrival delays (Tmax > = 7.5 sec) before and after ASL-based correction in all patients (n = 289 regions). Tmaxthresh was 3 sec. Note the improved correlation of CAD-CBF (R = 0.64) over either the ASL (R = 0.32) or the DSC uncorrected (R = 0.44) method alone. Red squares = DSC-CBF (before correction). Blue circles = CAD-CBF. Green triangles = ASL-CBF (same on both plots). Overlaid lines represent the slope and intercept of the regression (DSC uncorrected = red; CAD CBF = blue; ASL-CBF = green dashed).

