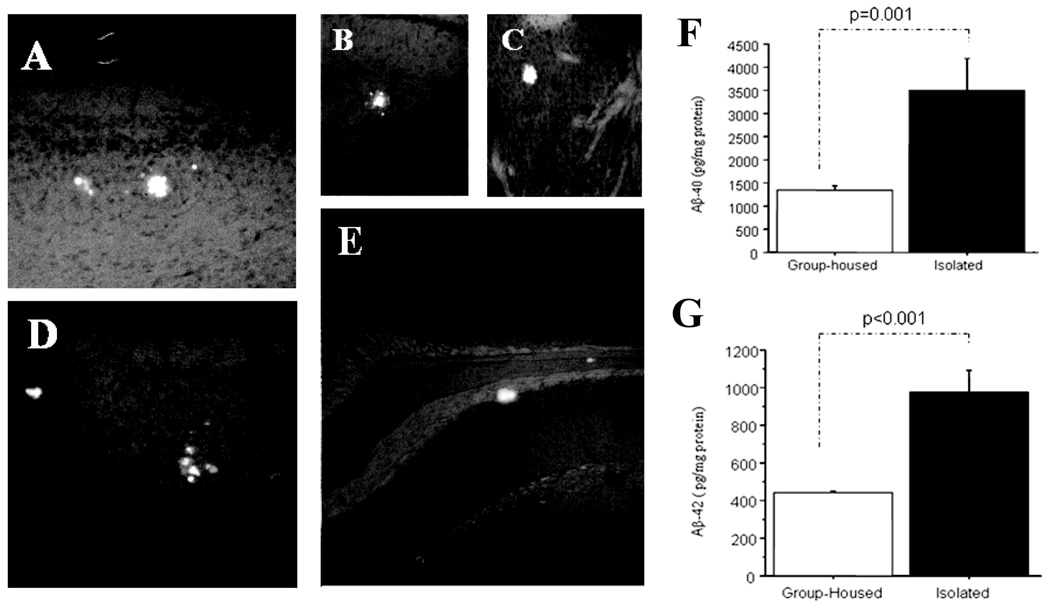
Fig. 1.
Thioflavin S fluorescence stains indicate that relatively smaller sizes of Aβ-plaques were distributed in the cortex (panel A and D), hippocampus (panel B and E), even in the stratum (panel C) [40, 80] after 6 months of isolation stress in the Tg+ mice brain, which were rare in Tg+ mice in age-matched group-housed controls. ELISA analysis indicates Aβ1–40 and Aβ1–42 levels in brain tissue were significantly increased in Aβ1–40 (panel F) and Aβ1–42 (panel G) in the 6 months isolation-stressed Tg+ mice as compared with group-housed Tg+ mice at the same age [87].

