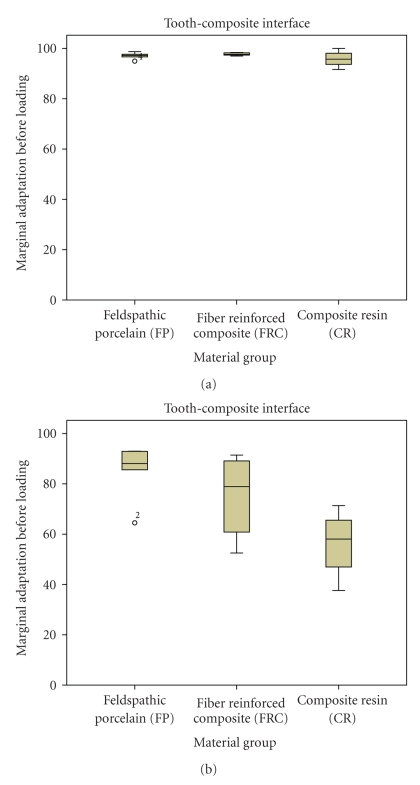
Figure 2.
Marginal adaptation at the Tooth-Composite interface. Boxplots displaying the percentages of continuous margins of the three groups before (a) and after (b) thermal (3000x) and mechanical loading (1.2 million cycles). Median, 25% / 75% percentiles, and the highest and lowest not extremely values are shown.

