Figure 6.
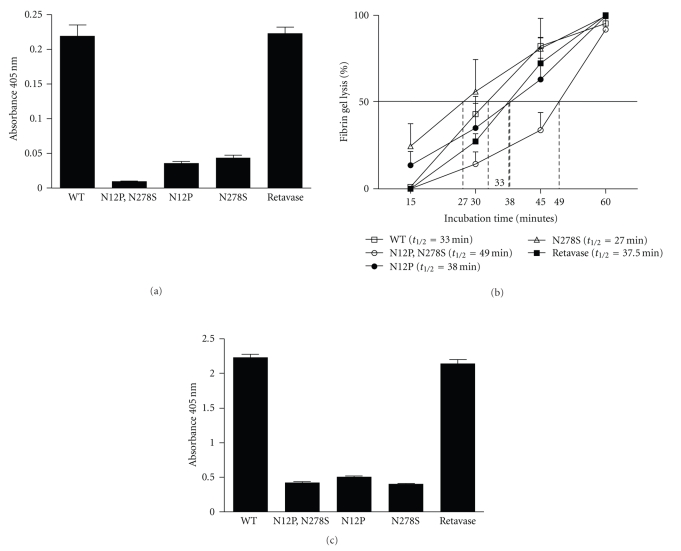
(a) Protease activity assay for rPA and its mutants. Sample 1 is WT (wild type rPA gene); sample 2: N12P, N278S double mutant; sample 3: N12P mutant; sample 4: N278S mutant; sample 5: commercial retavase preparation. (b) Clot lysis activity by turbidimetric fibrinolytic assay. X axis shows incubation time in minutes for clot lysis while Y axis shows % clot lysis. The horizontal line indicates 50% clot lysis while the vertical dotted lines indicate the t 1/2 values of different rPA samples. The course of clot lysis is demonstrated by connecting data points of different time intervals. (c) Plasminogen activation assay. X axis shows sample types while Y axis shows absorbance at 405 nm. Sample 1: WT rPA; sample 2: N12P, N278S double mutant; sample 3: N12P mutant; sample 4: N278S mutant; sample 5: commercial retavase preparation.

