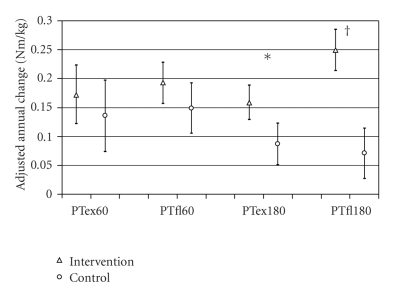
Figure 2.
Mean, with 95% confidence interval, absolute annual changes in the body mass adjusted knee extension (ex), and flexion (fl) peak torque at 60 and 180°/sec in the intervention and control group. All data represent the annual changes adjusted for baseline age and the baseline values for that specific measurement, if there was a significant group difference at baseline. *P < .01, † P < .001 versus control group.

