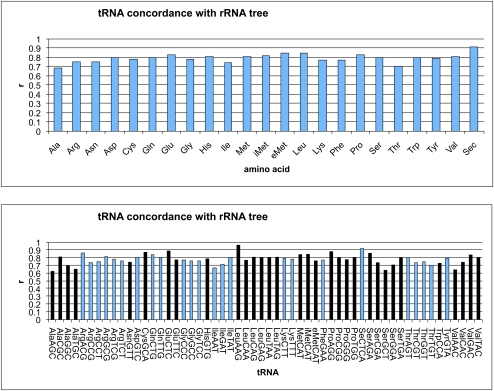
FIGURE 6.
Concordance of individual tRNA trees with the rRNA tree for the full set of tRNAs for each amino acid (top), and for each isoacceptor family of tRNAs separately (bottom). Y-axis values range from 0 (no correlation with tRNA tree) to 1 (perfect correlation). iMet and eMet refer to initiator methionine and elongator methionine tRNAs separately. In the tRNA graph (bottom), the tRNAs with each amino acid specificity are colored the same way, alternating dark and light by family for clarity.

