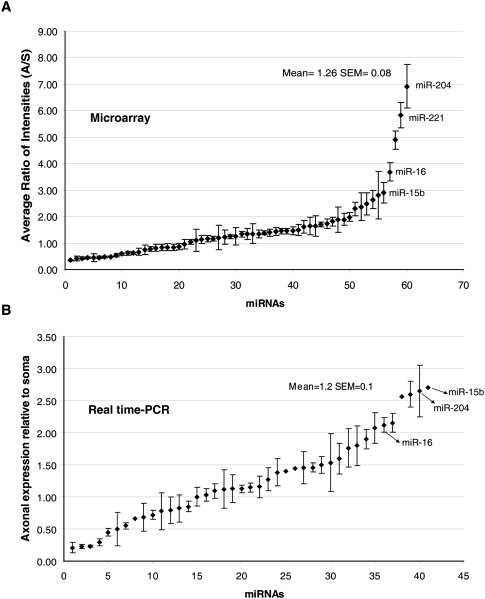
FIGURE 2.
A comparison of the abundance ratios (axon/soma) of miRNAs expressed in axons as judged by microarray analysis and qRT-PCR. (A) miRNA expression in the axons assessed by microarray. The average ratios of axonal miRNA intensities relative to miRNA intensity in the soma were calculated for 60 miRNAs. Error bars represent the standard error of mean (SEM) of six replicates. (B) miRNA expression in the axons assessed by real-time RT-PCR. Distribution plot shows the relative expression of axonal miRNAs compared with the soma as measured using miRNA-specific primers. Relative expression was calculated using the 2−ΔΔCT value after normalizing the CT values in the axons and soma to the corresponding levels of U6 snRNA. The distribution can be approximated as normal by means of the Shapiro-Wilk normality test (P = 0.286).

