FIGURE 5.
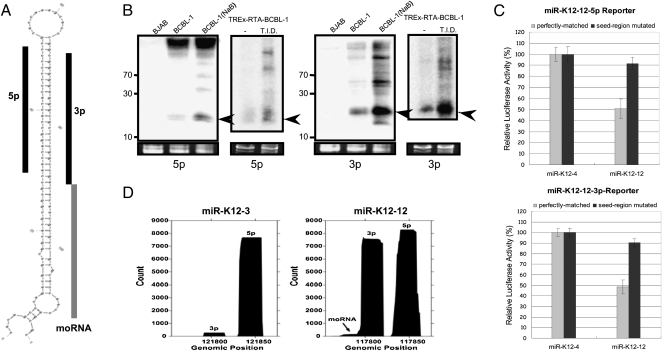
Multiple specific small RNAs derived from pre-miR-K12. (A) Predicted secondary structure of pre-miR-K12-12. The two derivative miRNAs, K12-12-5p (Griffiths-Jones 2006) and K12-12-3p (reported in this study), are indicated with black bars. The K12-12 moRNA is indicated with a gray bar. (B) Northern blot analysis of miR-K12-12 5p and miR-K12-12-3p. Two models of lytic induction were analyzed. RNA from regular BCBL-1 cells that were predominantly undergoing latent infection (untreated) or treated with sodium butyrate (NaB) to induce lytic replication was used. RNA from the nonisogenic, uninfected KSHV-negative BJAB cells serves as a negative control. Additionally, RNA from untreated, predominantly latent, or triple drug-treated T.I.D. (lytic-enriched) TREx-RTA BCBL-1 cells was analyzed. Arrows indicate miRNA band. (C) Luciferase assay demonstrates that both miRNA derivatives of pre-miR-K12-12 are active. Renilla luciferase reporter vector with four copies of miR-K12-12-5p or miR-K12-12-3p target sites were co-transfected with the pre-miR-K12-4 or pre-miR-K12-12 expression vectors. As a negative control, an identical reporter containing mutations in the seed complementary region was also analyzed. A normalization vector (firefly luciferase vector) was also co-transfected as a control for transfection efficiency. (D) Histogram of read coverage from the small induced (18–25, SI) library shows the relative abundance of miR-K12-12-5p, miR-K12-12-3p, and K-12 moRNA. 3p derivative miRNAs correspond to the left peak; 5p derivative miRNAs correspond to right peak. A histogram of reads mapping to pre-miR-K12-3 is shown for comparison.

