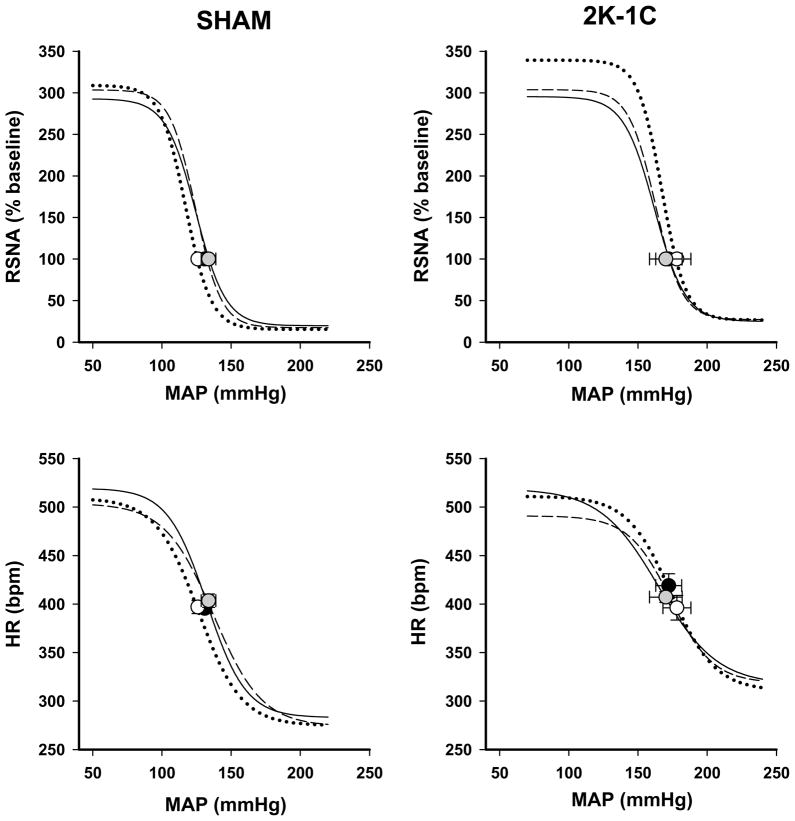
Figure 3. Baroreflex curves of heart rate and renal sympathetic nerve activity (RSNA) responses.
Mean baroreflex curves of RSNA and heart rate (HR) responses are shown for β-galactosidase (— • —); wild type nNOS (--- ---); dominant negative nNOS (⋯○⋯) for sham-clipped (left panel) and two kidney-one clip (right panel) groups. Symbols on the curves represent resting values (mean ± SE). See Table 3 for complete statistics and numbers in each group.

