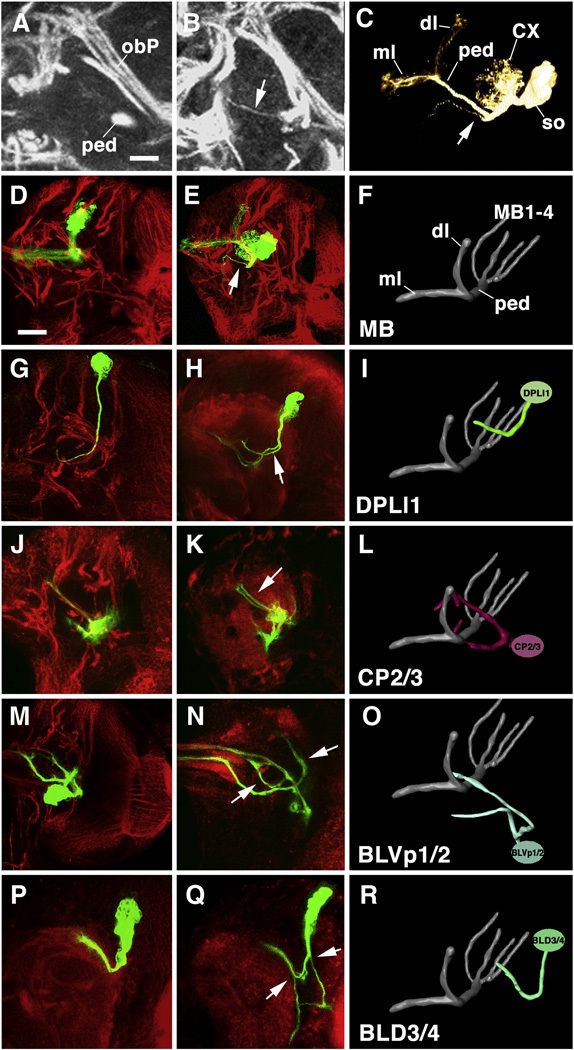
Fig. 5.
Phenotypic abnormalities in SAT branching and trajectory of DE-cad mutant clones. Panels of the middle column show Z-projections of frontal confocal sections of DE-cad mutant MARCM clones, paired up with Z projections of their wild-type counterparts (left column), and 3D renderings of these wild-type lineages (right column). In confocal images, clones are labeled green (GFP); global marker for lineages (anti-Neurotactin) or neuropile (anti-DNcad) was used as counterstaining (red), In panels of this and the following figure, only the right brain hemisphere is shown; the brain midline coincides with the left panel margin. 3D models are shown from antero-dorsally; the mushroom body is included for orientation. Arrows point at ectopic branches of SATs. A–F: Clone in mushroom body lineage. Note ectopic branch extending from SAT in proximal peduncle (ped; B, C, E). In wild type (A, D), no side branches of peduncle are ever observed. Panel C shows volume rendering of the DE-cad mutant mushroom body clone; anterior to the left (CX calyx; dl dorsal lobe; ml medial lobe; ped peduncle; so cluster of somata). G–I: Clone in DPLl1 lineage; J–L: CP2/3 lineage; M–O: BLVp1/2 lineage; P–R: BLD3/4 lineage.
Bars: 5µm (A, B); 25µm (all other panels).

