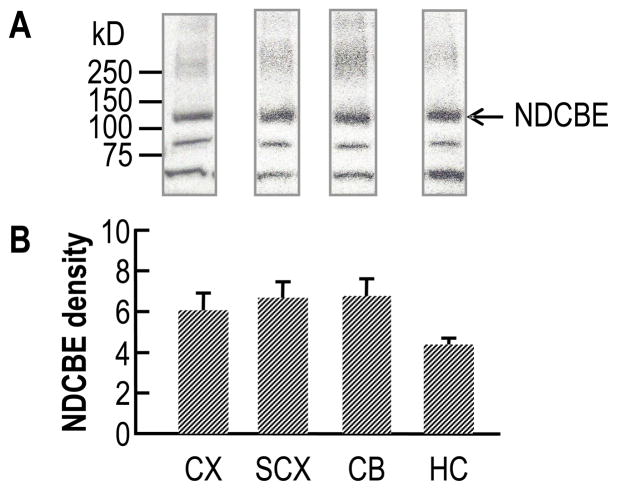
Fig. 4.
Relative distribution of NDCBE in different brain regions of mouse—cerebral cortex (CX), subcortex (SCX), cerebellum (CB) and hippocampus (HC)—as assessed by western blotting. (A) Western blots of membrane preparations. In each lane, 25 μg of total membrane protein was separated on 4–20% SDS gel. Crude antiserum was used at dilution of 1:2000. Depicted here are pooled data from five adult mice at an age of 114 days. The arrow indicates the NDCBE band of ~125 kDa (presumably the glycosylated NDCBE monomer). (B) Summary of densitometry data from experiments like those in panel A. Values are means ± SE for N = 5 pools of material (each pool representing 5 mice).

