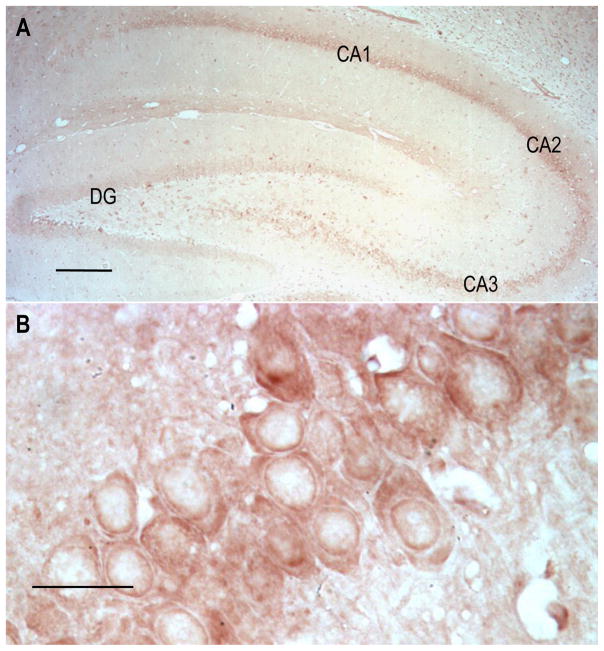
Fig. 9.
Immunocytochemistry staining of NDCBE in rat hippocampal sections. The section was stained with affinity-purified NDCBE antibody, and visualized by incubating with the HRP substrate Nova Red. (A) Low-power view. Scale bar: 100 μm. (B) Higher-magnification view of neurons in CA2 region. Scale bar: 20 μm. CA1–3: Cornu Ammonis fields; DG: dentate gyrus.

