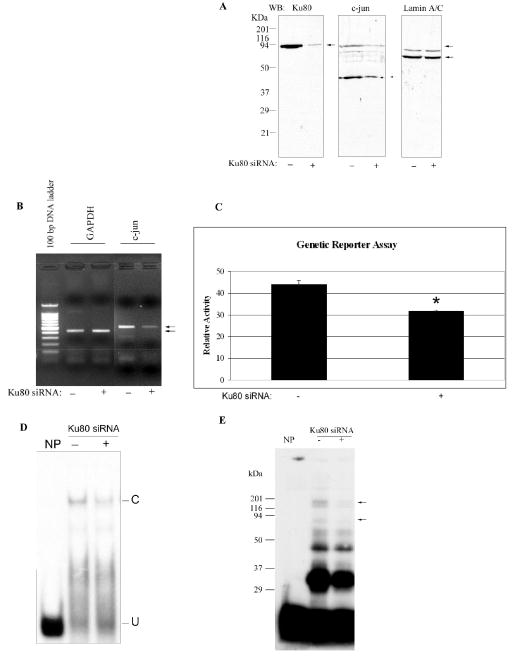
FIG. 7.
Ku80-siRNA introduction decreases Ku80 and c-jun expression. A, Western blotting analysis of Ku80, c-jun and lamin A/C show the down-regulation of Ku80 and c-jun protein in HEK293 cells after Ku80-siRNA transfection. Ku80-siRNA (20 nM, +) or control siRNA (20 nM, -) was transiently transfected into 2 × 10⁵ HEK293 cells and after 48 h, nuclei were isolated. Nuclear extract (50 μg) was used for western blotting analysis with antibodies against Ku80, c-jun and lamin A/C. B , Ku80-siRNA affects c-jun mRNA expression by RT-PCR analysis. Eighteen hours after Ku80-siRNA was transfected into HEK293 cells, the total RNA was extracted and reverse transcribed, the synthesized cDNA was then used for semi-quantitative PCR using primers for c-jun and GAPDH ORFs. c-Jun was amplified for 35 cycles, while GAPDH was thermocycled for 17 cycles and serves as a control, showing approximately equal cDNA in each sample. The PCR product of the correct size is indicated by the arrow on the right. C, Ku80 plays a positive role in c -jun promoter activity by genetic reporter assay using Ku80-siRNA. HEK293 (2 × 10⁵) cells were transiently cotransfected with the 10 ng of pMLuc-1-c-jun reporter plasmid, 2 μg of normalization plasmid (pTK-Luc) and 20 nM of Ku80 (+) or control siRNA (−). After 48 h, the cells were lysed and analyzed by dual luciferase assay. The data are expressed as the mean ± S.D. (n = 4). *, p < 0.05 vs. the control. D, EMSA analysis confirms the presence of Ku80 in the element binding complex using Ku80-siRNA transfection. Nuclear extract (5 μg) from Ku80-siRNA (+) or control siRNA (-) transfected HEK293 cells was incubated with labeled WT element for EMSA analysis. C, specifically shifted band; U, unshifted double stranded DNA. E, UV cross-linking analysis of DNA-protein adducts formed in Ku80-siRNA transfected HEK293 cells. The DNA-protein complex as in Fig. 7D was UV cross-linked on ice for 30 min. The arrows on the right indicates the 125 kDa. complex (115 kDa. of which is protein) and the 80 kDa. band. The molecular mass of standards are shown on the left.

