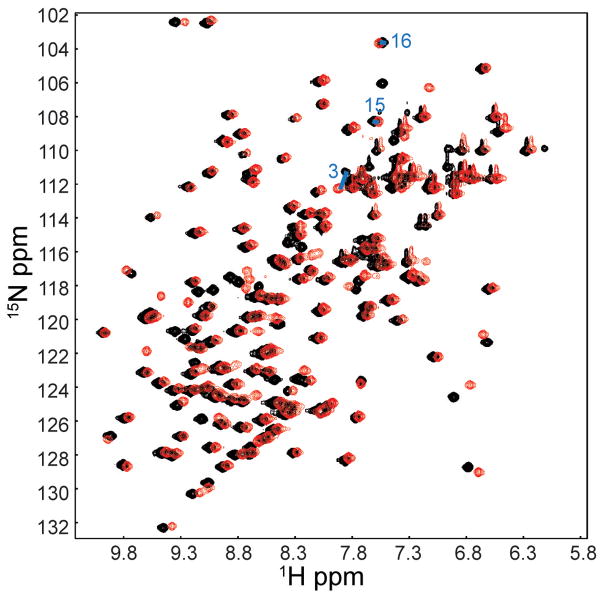
Figure 3. NMR spectra of purified 1mM LDF18.
1H-15N HSQC overlay of LDF18 in the mannose-free (black) and mannose-bound (red) forms. The latter contains 1mM α-MM, which is a 1:1 ratio of protein to mannose. Large chemical shift differences are not observed between the two spectra, indicating that binding of mannose induces only small, local conformational changes. See also Figure S1.

