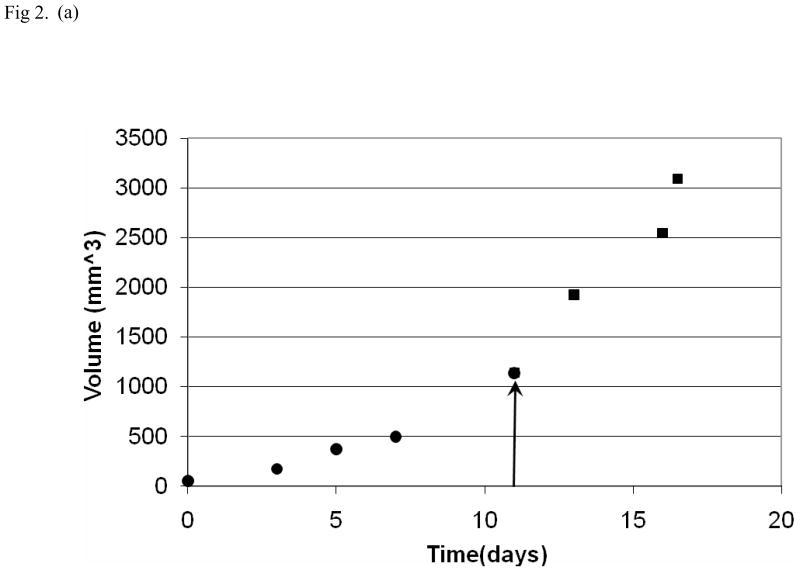
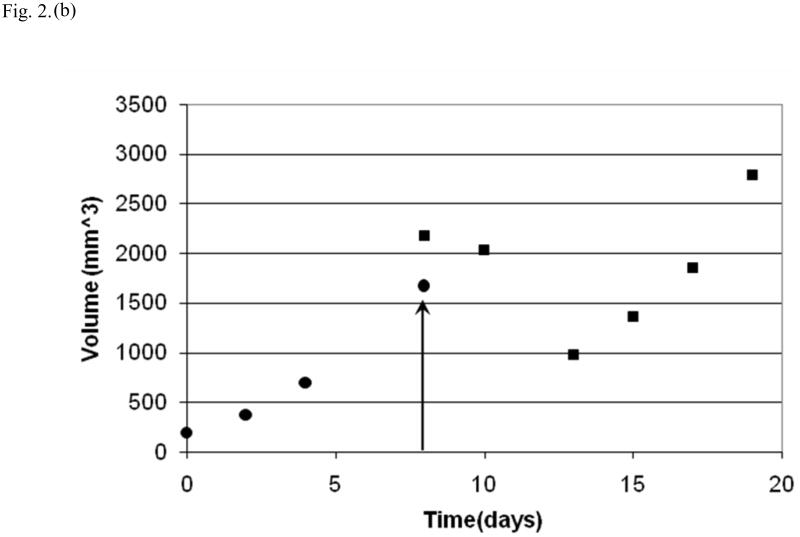
Fig. 2.
Tumor growth curves for individual mice (black dots = tumor volume before therapy; black squares = tumor volume after therapy; day of therapy indicated by arrow). In a mouse from the control group (a) there is continued growth of tumor following the sham-treatment. After low-intensity ultrasound therapy in another mouse (b), there was an immediate initial increase in tumor volume followed by a decline over the next five days and then a further increase.


