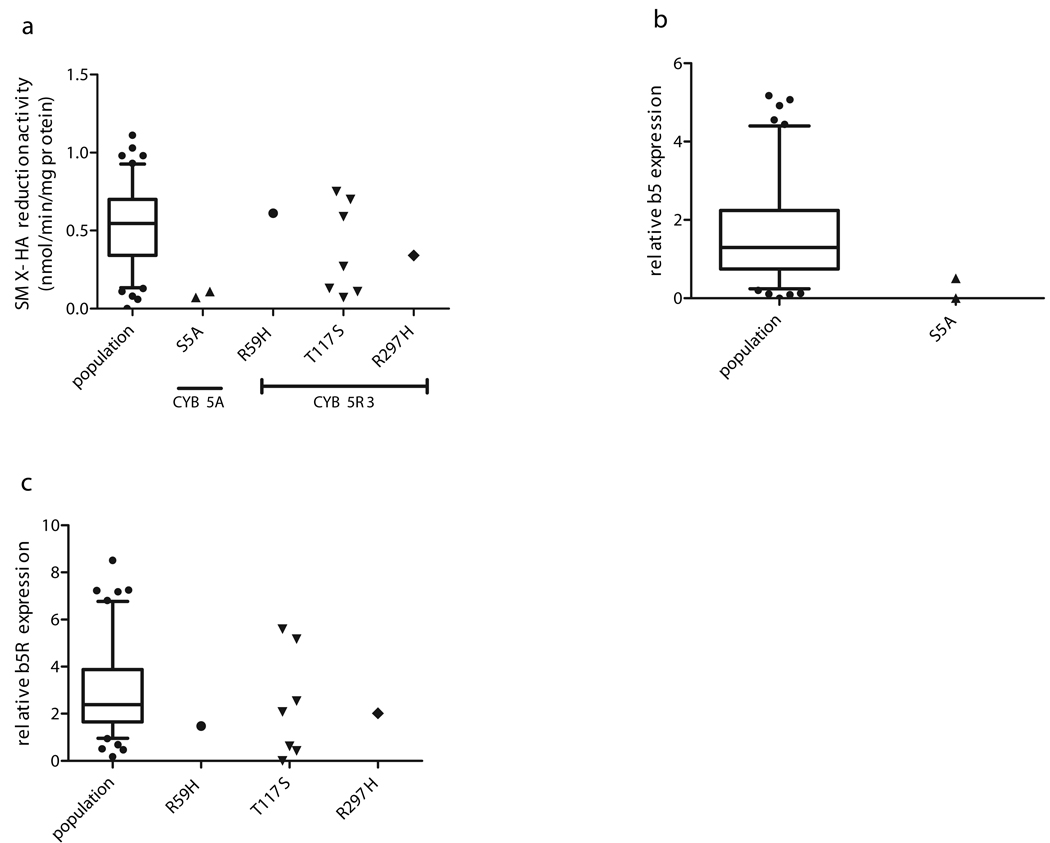
Fig 3.
SMX-HA reduction activity (a), b5 protein (b), and b5R protein expression (c), in livers heterozygous for non-synonymous cSNPs in CYB5A and CYB5R3, compared to WT population data. Experimental data for the population is shown as a whisker-box plot with the box representing median and interquartile range, and the whiskers representing 95th and 5th percentiles. Outlying values for the WT population are shown as individual points outside the whiskers.

