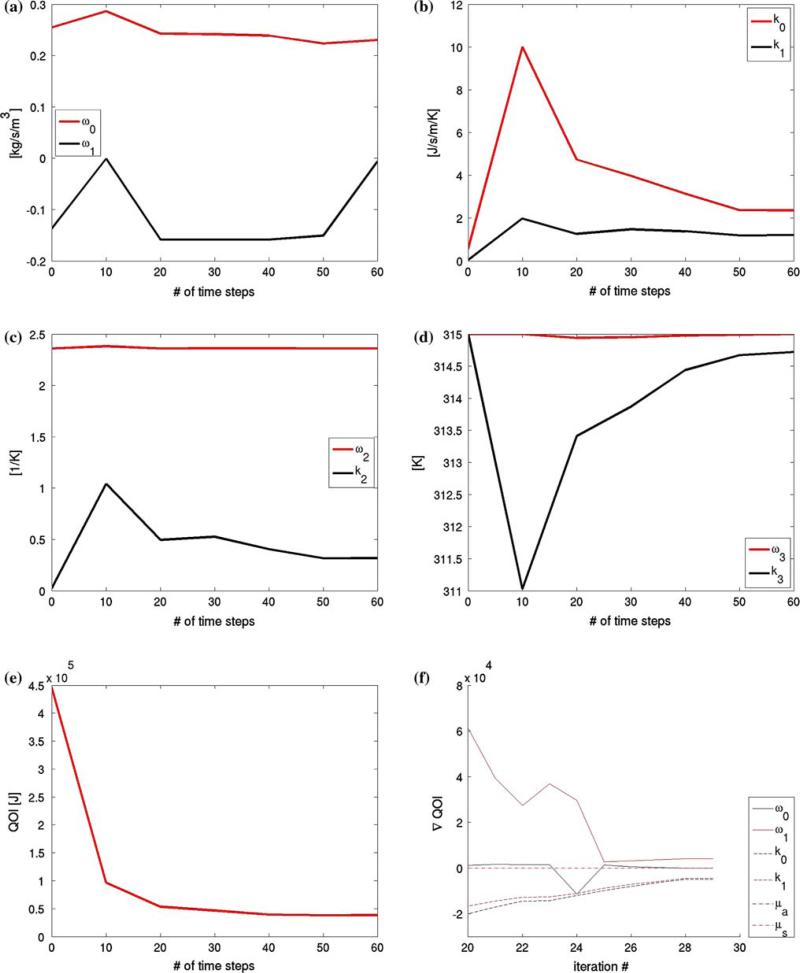
Fig. 6.
Calibration results a–d Calibrated thermal conductivity and blood perfusivity parameters as a function of the number of thermal images used in the objective function, N = 10, 20, 30, 40, 50, 60. Sensitivity of Objective Function e and f The value of the objective function, (5), is plotted as a function of the number of thermal images used to obtain the calibrated parameters, which indicate that both objective functional and its gradient become insensitive to the number of images included in the calibration if N > 30

