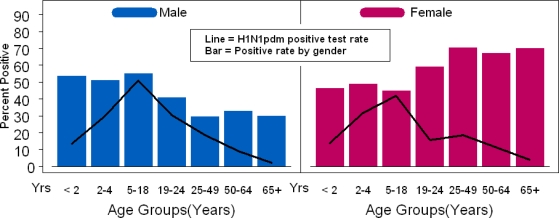
Figure 1.
Age distribution of patients infected with influenza A H1N1pdm. Lines indicate H1N1pdm positive rate (e.g., number of patients positive/number of patients tested) by age group. Bars indicate the proportion of all patients positive in a given age group by gender (e.g., males plus females = 100%).

