Figure 1.
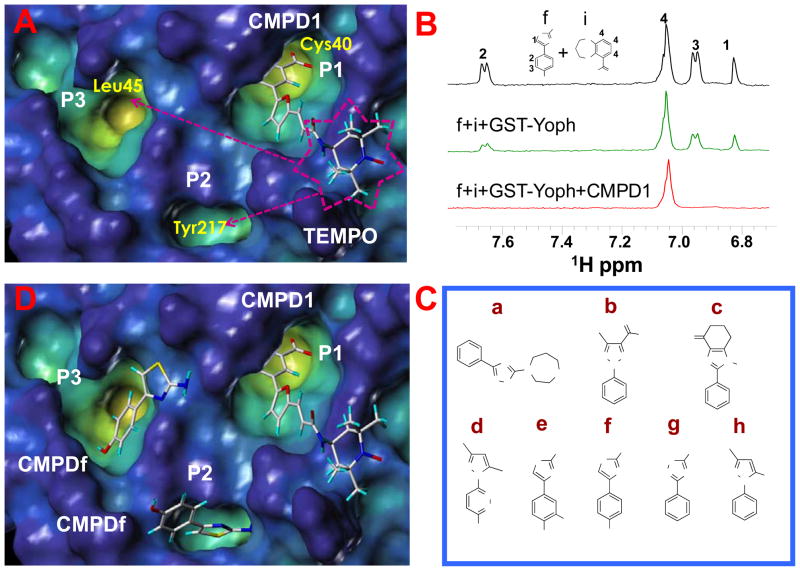
(A) Docked conformation of the TEMPO compound (number 1 in Table 1) in the YopH C-terminal domain (pdb code, 1QZ0). The surface of the protein is displayed in the cavity depth mode (yellow: deep, blue: shallow), the compound is shown in capped sticks. P1 represents the catalytic site, two close additional pockets are indicated as P2 and P3. (B) T1ρ spectra acquired with a mixing time of 200 ms of the small molecules f (YopH-binder) and i (control non-binder compound) at 1 mM concentration each (black); in presence of GST-YopH (10 μM) (green) and in simultaneous presence of GST-YopH and the TEMPO labeled compound 1 (500 μM) (red). Only the aromatic regions of the spectra are shown. Spectra were acquired on a 500 MHz Bruker Avance spectrometer; sample buffer consists of 30 mM Tris-d11, 150 mM NaCl pH=7.5 with 10% D2O. (C) Chemical structures of second-site binders identified through NMR screening. (D) Compound 1 and fragment f have been simultaneously docked in YopH. Two possible docking poses for the fragment f are shown.

