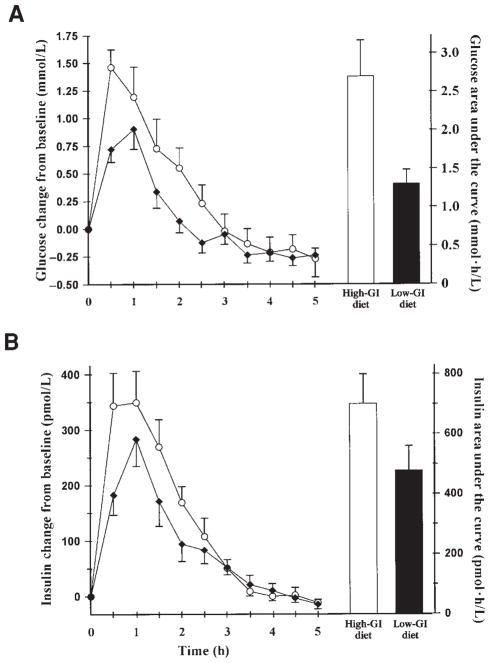
FIGURE 2.
Glycemic (A) and insulinemic (B) responses measured at 0.5-h intervals. Curves are mean (± SEM) values after breakfast, lunch, and dinner on day 1. Columns represent area under the concentration-versus-time curve calculated by using the trapezoidal rule. Actual baseline blood glucose for the high-glycemic-index (high-GI) diet (○) was 5.5 ± 0.2 mmol/L and for the low-glycemic-index (low-GI) diet (◆) was 5.3 ± 0.2 mmol/L (NS; n = 10).

