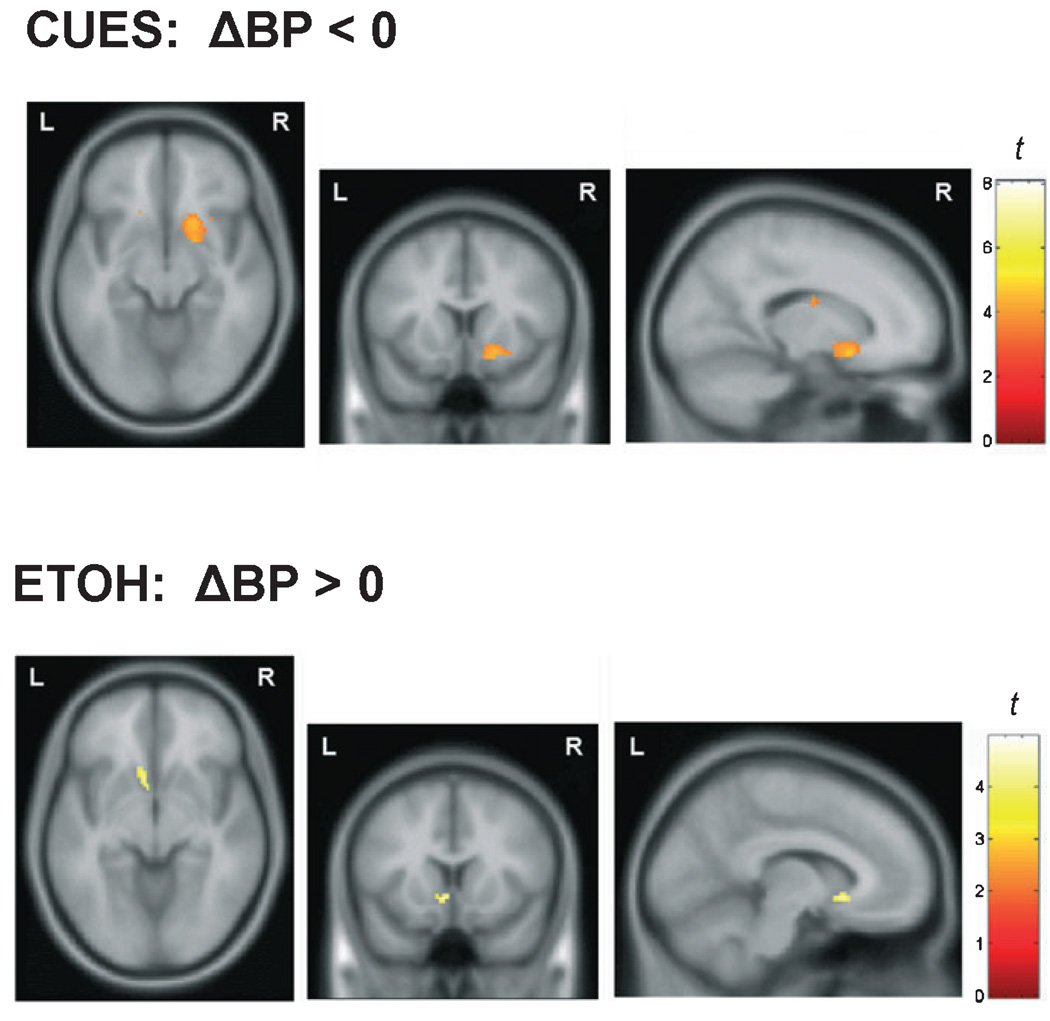
Fig. 5.
Axial (left), coronal (middle), and sagittal (right) maps of t-values from voxel-wise statistical testing. Top: Voxel-wise 1-sample t-test to determine if ΔBPND at each voxel was significantly < 0. Dopamine levels were significantly lower during the alcohol-related cues (CUES) condition relative to the baseline (neutral cues) condition (display threshold p < 0.005). Bottom: Voxel-wise 1-sample t-test to determine if ΔBPND at each voxel was significantly >0. Dopamine levels were significantly higher during the unanticipated alcohol (EtOH) condition compared with the baseline condition (display threshold p < 0.005).

