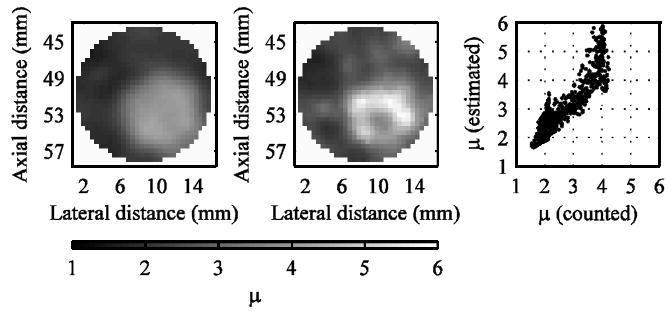
Fig. 9.

Comparison of the scatterer number density obtained by counting the number of scatterers in each ROI (left) and through estimates based on the envelope statistics model (middle). The scatter plot (right) shows a comparison of the μ parameter values on an ROI-by-ROI basis.
