
Figure 4.
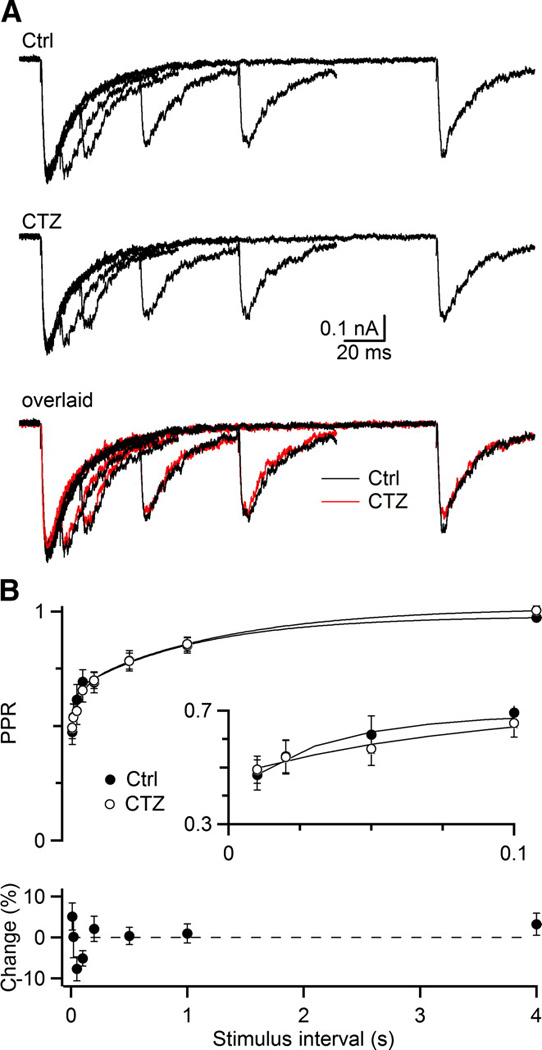
CTZ has no effect on the NMDA EPSC. A, Representative NMDA EPSCs measured in the presence of 10 µM NBQX and 3 Cae, shows the NMDA EPSC in control (upper), after addition of CTZ (middle), and these two sets of traces overlaid (bottom, CTZ in red). Traces are the average of 4 to 5 trials. B, Averaged PPR (upper) and relative change in PPR (bottom) from 6 experiments. Curves are double-exponential fits to the experimental data (see legend to Fig. 1). In control, A1 = 0.23 ± 0.06, τ1 = 71 ± 5 ms, A2 = 0.33 ± 0.05, τ2 = 1.6 ± 0.3 s. In CTZ, A1 = 0.25 ± 0.06, τ1 = 75 ± 5 ms, A2 = 0.30 ± 0.05, τ2 = 1.6 ± 0.3 s.