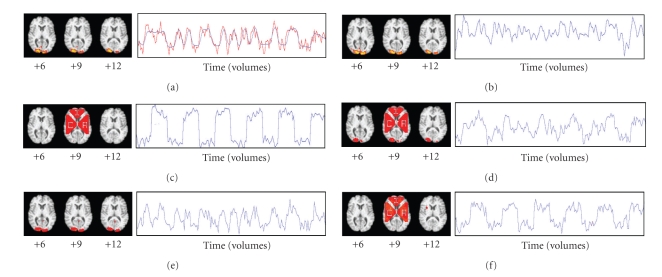
Figure 2.
Spatial maps and time courses derived from task-related GLM, ICA, seed-based approach, and hybrid ICA-seed-based approach. Numbers below axial brain slices indicate z-coordinate (MNI). Blue lines: time courses from linear model. Red lines: fMRI data deviating from model, at voxel with best fit to model. (a) Task-related GLM. (b) Natural IC. (c) Artificial IC. (d) Seed-based FC. (e) Hybrid FC, seed from natural IC. (f) Hybrid FC, seed from artificial IC. The bright yellow dots (d–f) show seed locations.

