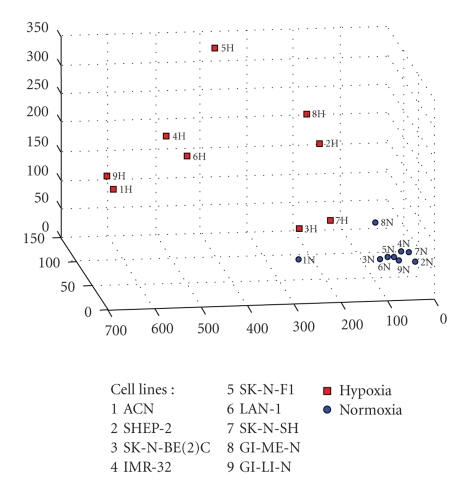
Figure 1.
Three-dimensional representation of the principal components analysis of the Glycolysis GO process. Principal components representation of the multivariate analysis performed on the 9 cell lines by l1-l2 algorithm. This figure illustrates a 3-dimensional visualization of the dataset restricted to the selected probesets projected on their 3 principal components. Red squares (H) represent the cell lines in hypoxic status and the blue circles (N) the corresponding cell lines in normoxic status. The numbers indicate the cell lines.

