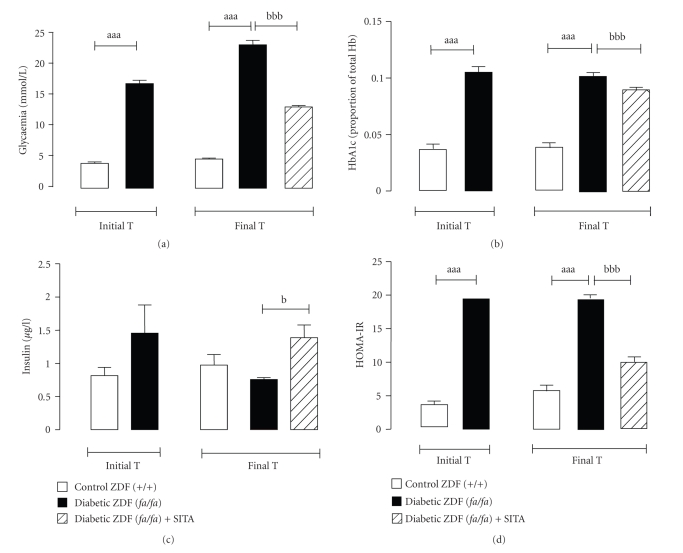
Figure 1.
Glycaemic and insulinaemic profiles. Serum Glycaemia (a), HbA1c (b), insulinaemia (c) and insulin resistance (HOMA-IR) index (d), for the control (+/+) and diabetic (fa/fa) ZDF rats, in the initial and final times (6 weeks of vehicle or 10 mg/kg BW/day sitagliptin treatment). Comparisons between groups (n = 8 each): a - ZDF (fa/fa) versus ZDF (+/+) and b - with sita versus without sita; P < .05, P < .01 and P < .001 for one, two or three letters, respectively. HOMA-IR, homeostasis model assessment—insulin resistance.

