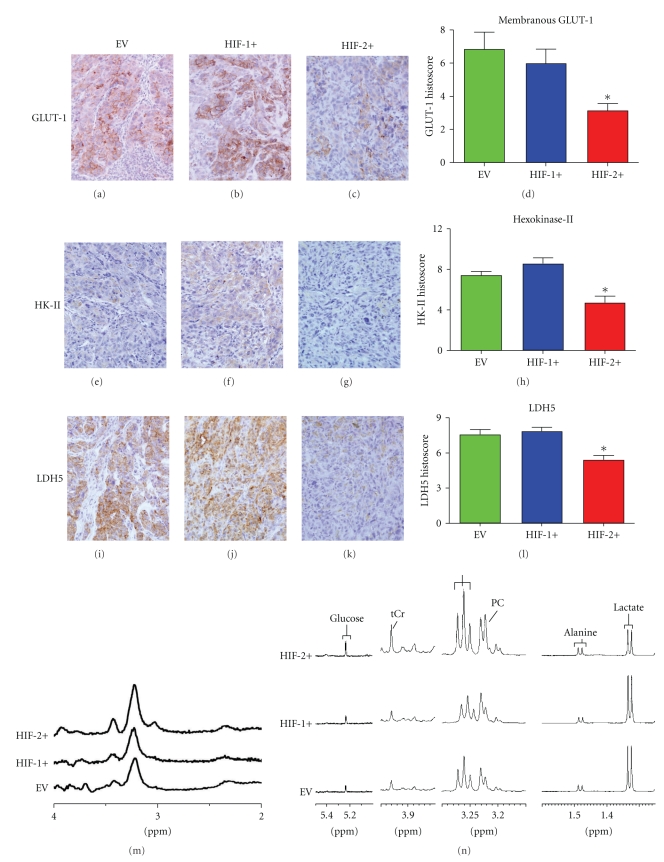
Figure 4.
Metabolism-related markers and metabolic profiles of CCRCC 786-0 tumors (x100 hpf). (a–d) GLUT-1 expression(*P = .01). (e–h) Hexokinase-II expression (*P = .0006). (i–l) LDH5 expression (*P = .004), (m) In vivo 1HMRS of 786-0 tumors. (n) High-resolution 1HMR Spectra of tumor extracts. *P values were calculated using an ANOVA test.

