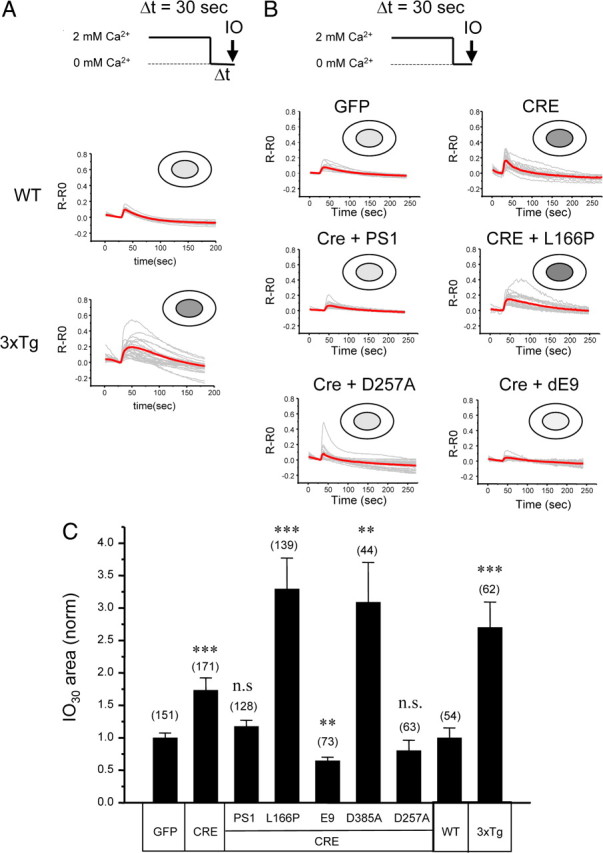
Figure 2.

Ionomycin-sensitive Ca2+ pool in 3xTg and PS DKO hippocampal neurons. A, B, Fura-2 340 nm/380 nm ratio traces are shown for WT and 3xTg hippocampal neurons (A) and for PScDKO hippocampal neurons infected with Lenti-GFP or Lenti-Cre viruses or lentiviral combinations (B). The neurons were moved to Ca2+-free media for 30 s and challenged with 5 μm IO. Individual cell traces (gray) and average traces (red) are shown for each group of neurons. C, The average size of ionomycin-sensitive Ca2+ pool after 30 s incubation in Ca2+ free media (IO30). The area under IO-induced fura-2 signal was integrated for each neuron. In each experiment, IO30 values were normalized to IO30 values measured for the WT group (for 3xTg experiments) or to the GFP-infected group (for PScDKO experiments). The normalized responses from different experiments were averaged and presented as mean ± SE (n indicates number of cells analyzed). The IO30 values in 3xTg neurons were compared with IO30 values in WT neurons, and the IO30 values in PScDKO neurons were compared with IO30 values in the GFP-infected group. **p < 0.01; ***p < 0.001. n.s., Not significant.
