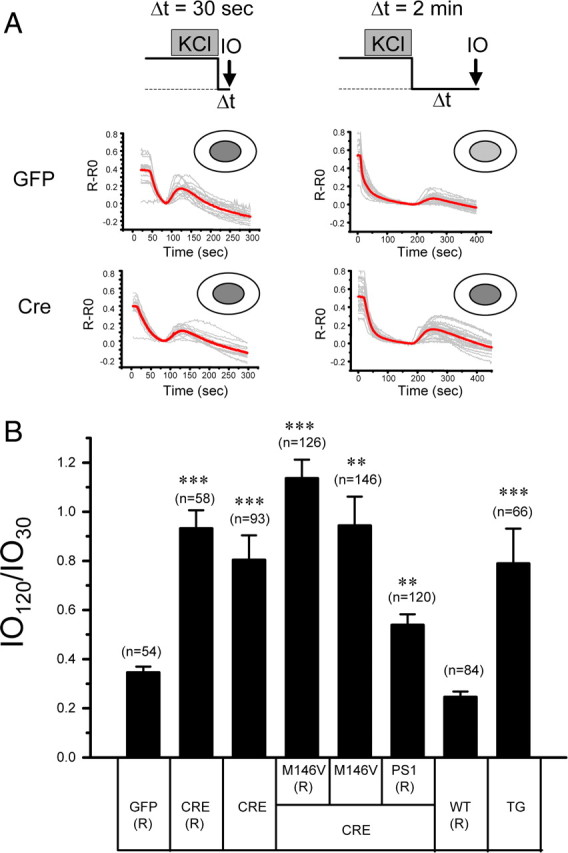
Figure 5.

The ER Ca2+ leak measurements in 3xTg and PS DKO hippocampal neurons. A, Fura-2 340 nm/380 nm ratio traces are shown for PScDKO hippocampal neurons infected with Lenti-GFP or Lenti-Cre viruses. The neurons were stimulated with 15 mm KCl for 1 min in aCSF and then moved to Ca2+-free media for 30 or 120 s and challenged with 5 μm IO. Individual cell traces (gray) and average traces (red) are shown for each group of neurons. B, The average ER Ca2+ residual pool is shown as the IO120/IO30 ratio. In each experiment, IO30 and IO120 values were measured, and the IO120/IO30 ratio was determined for each batch of neurons. The IO120/IO30 ratios from different experiments were averaged and presented as mean ± SE (n indicates number of cells analyzed). The experiments that included the 15 mm KCl refill protocol are indicated with “(R).” The IO120/IO30 ratio in 3xTg neurons was compared with the IO120/IO30 ratio in the WT(R) group of neurons. The IO120/IO30 ratios in PScDKO neurons were compared with the IO120/IO30 ratio in the GFP(R) group. **p < 0.01; ***p < 0.001.
