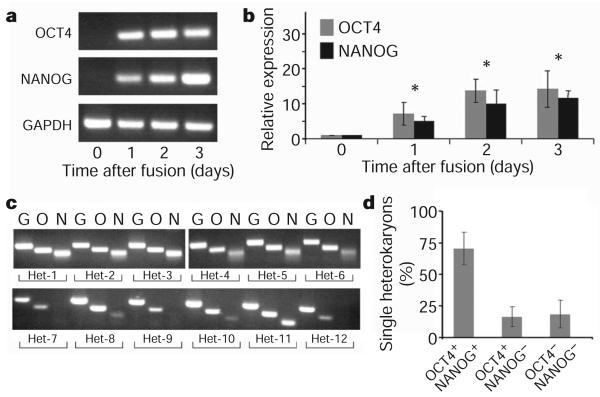
Figure 2. Time course of human fibroblast pluripotency gene expression in heterokaryons at the single-cell level.
a, Human-specific primers against OCT4, NANOG and GAPDH were used for transcript analysis by RT–PCR of unfused co-cultures on day 0 and heterokaryons (mES 3 hFb) isolated on days 1, 2 and 3 after fusion. b, Real-time PCR to assess the upregulation of OCT4 (grey) and NANOG (black) in day 1, 2 and 3 heterokaryons using human-specific primers (mean ± s.e.m.; *P, 0.03). Unfused co-cultures served as day 0 controls and the expression of OCT4 and NANOG was normalized to GAPDH expression. Data shown are from three independent fusion experiments. c, Single heterokaryon nested PCR was used to assess the efficiency of reprogramming in the heterokaryon population. Direct reverse transcription and nested PCR were performed simultaneously on day 3 single heterokaryons, using human-specific primers for GAPDH (G), OCT4 (O) and NANOG (N) as indicated. Twelve heterokaryons analysed from a single fusion experiment are shown. Supplementary Fig. 3 shows 41 heterokaryons analysed from two additional fusion experiments. d, The frequency of heterokaryons expressing both OCT4 and NANOG is 70 ± 13%, showing that a high proportion of heterokaryons initiate reprogramming towards pluripotency. Data shown are a summary of three independent fusion experiments (mean ± s.e.m.).

