Figure 6.
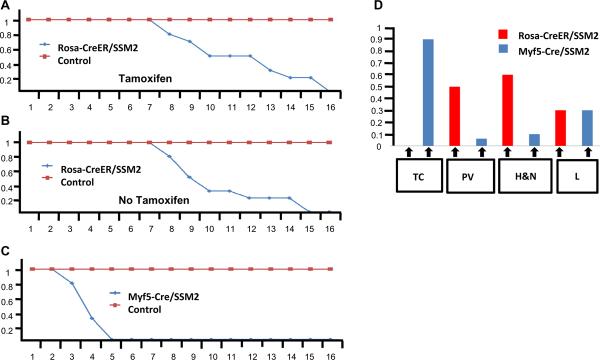
SSM2+/−/R-CreER+/− mice (n=7) and control mice comprising of SSM2+/−, R-CreER+/−, and wild type (n=18) were injected intraperitoneally with one pulse of 0.1 mg/gm of Tamoxifen at 3 months of age. These mice were followed up and the percentage of mice surviving (y axis) was plotted against age (x axis). This reveals that that all SSM2+/−/R-CreER+/− mice injected with Tamoxifen were dead or moribund by 16 months of age while all controls were still alive (6A). A similar comparison was carried out without Tamoxifen injection between SSM2+/−/R-CreER+/− mice (n=6) and control mice comprising of SSM2+/−, R-CreER+/−, and wild type (n=18) that revealed a similar survival differences (6B). In comparison, the survival data from the SSM2+/−/Myf5-Cre+/− mice (n=12) are significantly different where all SSM2+/−/Myf5-Cre+/− mice usually die by 5 months of age (6C).
6D represents the anatomical distribution of tumors detected within SSM2+/−/Myf5-Cre+/− (n=18) and SSM2+/−/R-CreER+/− (n=11) mice. The colored boxes represents the percentage of mice (y axis) harboring tumors in a certain anatomical location (x-axis). TC = Thoracic Cage, PV = Para-vertebral, H&N = Head and Neck, and L = Limbs.

