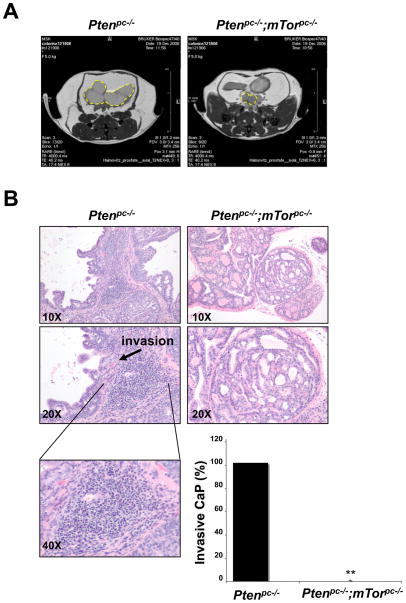
Figure 3. mTor inactivation opposes Pten-loss induced tumor progression from in situ to invasive cancer lesions.
(A) MRI analysis of prostatic tumors (dashed yellow circles) in Ptenpc−/− and Ptenpc−/−;mTorpc−/− 6 month old mice. (B) H&E staining of AP sections from 6 month old Ptenpc−/− and Ptenpc−/−;mTorpc−/− mice. Focal invasion in Ptenpc−/− mouse prostate is indicated by an arrow. Inflammatory infiltration in Ptenpc−/− mouse prostate is shown at higher magnification in the lower left panel. Lower right panel: percentage of Ptenpc−/− and Ptenpc−/−;mTorpc−/− 6 month old mice with signs of invasion in the prostate. Four mice from each genotyping were analyzed. **, P < 0.01.

