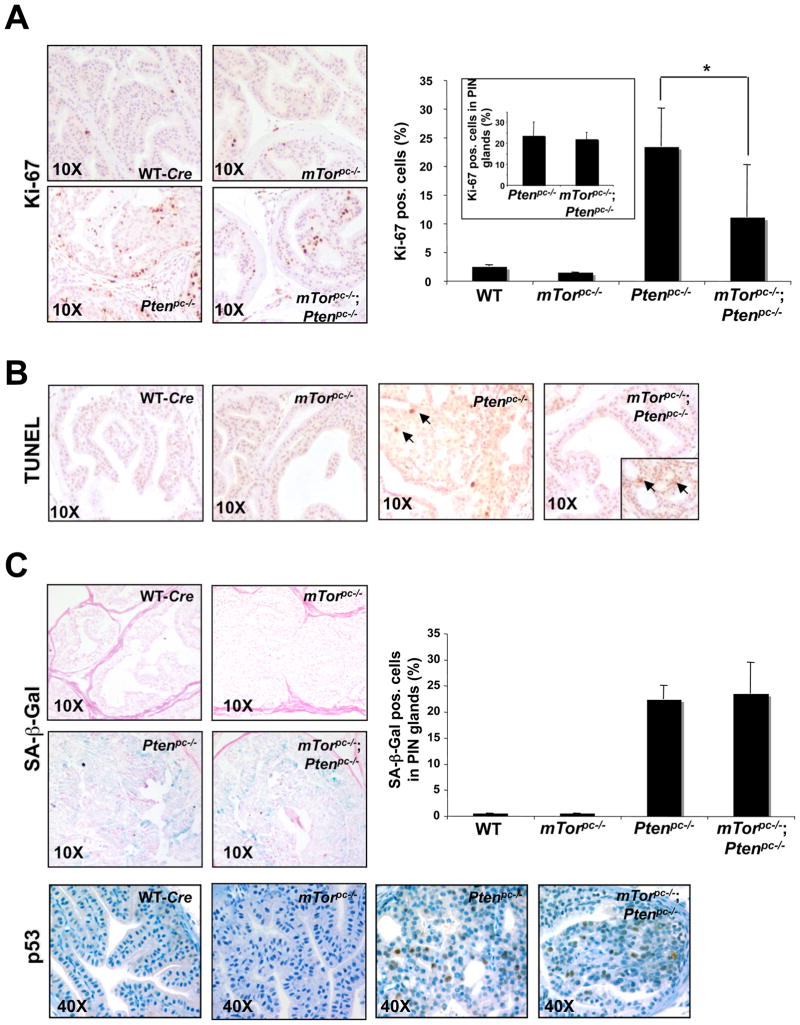
Figure 4. Biological outcome of mTor deletion in the WT and Ptenpc−/− prostate.
(A) Left panel: Ki-67 staining on prostate sections from 3 month old mice of the indicated genotypes. Right panel: quantification of Ki-67. Pos. stands for positive. Three different areas of one section were counted to determine an average and representative value for each slide. Slides from three independent mice were counted in this way to determine a standard deviation for the population. *, P < 0.05. The inset shows the Ki-67 quantification exclusively in the PIN lesions of the Ptenpc−/− and Ptenpc−/−;mTorpc−/− mice prostates. (B) TUNEL assay for apoptosis on prostate sections from 3 month old mice of the indicated genotypes. The arrows show examples of TUNEL positive cells. The inset in the Ptenpc−/−;mTorpc−/− prostate section shows the TUNEL staining in a residual PIN lesion. (C) Upper left panel: senescence-associated β-Galactosidase staining (SA β-Gal) on prostate sections from 3 month old mice of the indicated genotypes. Upper right panel: quantification of the SA β-Gal staining in the glands affected by PIN of the prostate sections from 3 month old mice of the indicated genotypes. Quantifications were done on three representative sections from three mice. There is not significant difference between the PIN lesions of Ptenpc−/− and Ptenpc−/−;mTorpc−/− prostates. Pos. stands for positive. Lower panel: IHC for p53 on the same mice showed in the upper panel.

