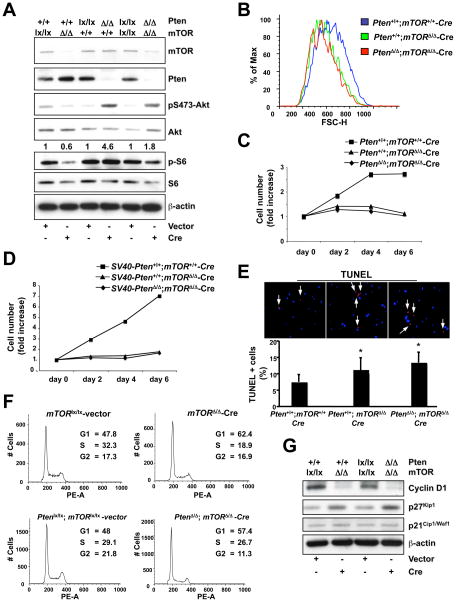
Figure 5. Biological outcome of mTor deletion in mouse embryonic fibroblasts (MEFs).
(A) Western blot analysis of lysates of mTorloxP/loxP, PtenloxP/loxP and PtenloxP/loxP;mTorloxP/loxP MEFs infected with PURO-IRES-GFP (vector) or Cre-PURO-IRES-GFP (Cre) (see experimental timeline shown in Supplementary Fig. 3A). Quantification of the phospho-Akt/total Akt ratio is shown. Quantifications were done by densitometry analysis performed with ImageJ software. For each genotyping the phopho-Akt/total Akt value of Cre-infected cells is normalized against the corresponding vector-infected control. (B) Flow cytometric analysis (Forward Scatter, FSC-H) of the mTor-null (Pten+/+;mTorΔ/Δ-Cre) and Pten;mTor-double null MEFs (PtenrΔ/Δ;mTorΔ/Δ-Cre) compared to the WT (Pten+/+;mTor+/+-Cre). (C) Cell proliferation curve analysis of the same MEFs analyzed in (B) followed over a 6-day period. (D) Cell proliferation curve analysis of mTorloxP/loxP and PtenloxP/loxP;mTorloxP/loxP primary MEFs firstly immortalized with SV40 large-T antigen, and subsequently infected with PURO-IRES-GFP (vector) or Cre-PURO-IRES-GFP (Cre). (E) TUNEL assay on the same MEFs analyzed in (B). *, P < 0.05. (F) Flow cytometric analysis of mTorloxP/loxP and PtenloxP/loxP;mTorloxP/loxP MEFs infected with PURO-IRES-GFP (vector) or Cre-PURO-IRES-GFP (Cre) (see experimental timeline shown in Supplementary Fig. 3A). In order to accurately evaluate cell cycle populations, data was gated to exclude the sub-G1 population. (G) Western blot analysis on the lysates of mTorloxP/loxP and PtenloxP/loxP;mTorloxP/loxP MEFs infected with PURO-IRES-GFP (vector) or Cre-PURO-IRES-GFP (Cre) (see experimental timeline shown in Supplementary Fig. 3A).

