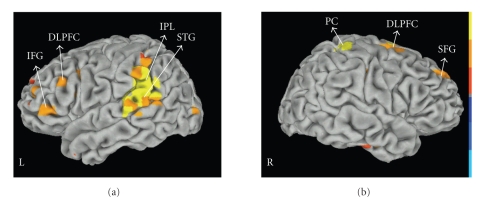
Figure 4.
Group maps corresponding to 200 ms interval (from −1700 ms to −1500 ms) preceding the trials onset at beta frequency (14–30 Hz); P < .01 corrected; DLPFC: dorsolateral prefrontal cortex; IFG: Inferior frontal gyrus; IPL: inferior parietal lobe; PC: postcentral gyrus; SFG: superior frontal gyrus. Red color coding indicates task related power increase; blue color coding indicates task related power decrease. The figure shows data rendered onto a Talairach-space surface template.

