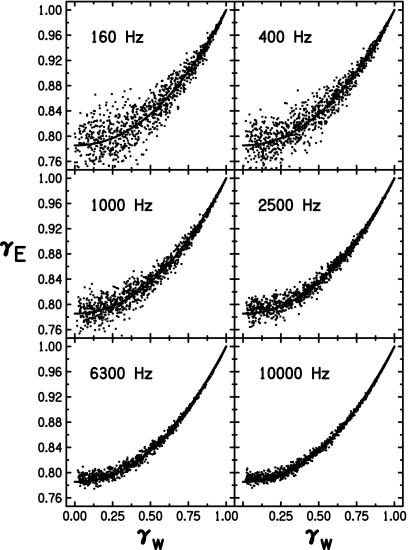
Figure 1.
Plots of envelope interaural coherence versus waveform interaural coherence for simulated binaural signals using Gaussian noise pairs in six different 1∕3-octave bands. Each band contains 1001 coherence pairs, each of which is a single data point. A best-fitting line to Eq. 6 is shown as a thick solid line in each plot, though it may be obscured by the data points. The value of the power parameter n, to two significant figures, is 2.1 for each set of points in each panel.

