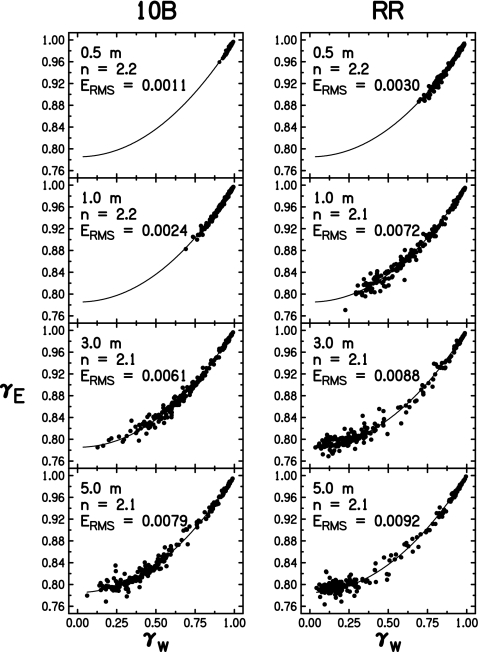
Figure 2.
Combined envelope versus waveform-coherence data across all 1∕3-octave bands measured in rooms 10B and the reverberant room at each source distance. Trend lines show the best fit of the data in each panel to Eq. 6. The value of the fitting parameter n is shown in the upper-left corner of each panel. Because of the relative insensitivity of the curve to the exact value of n, only standard deviations greater than ±0.05 are given. The rms error of the data to the best fit Erms is given on the scale of coherence (0–1.0). Therefore, in room 10B at 1.0 m, where the mean γE is 0.96 and the rms error is 0.0024, the rms error is 0.25%.

