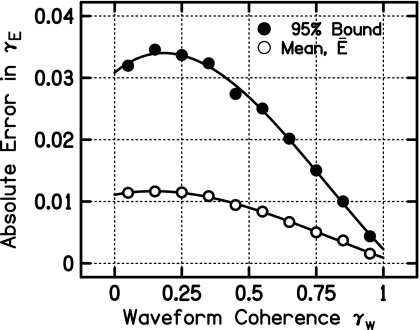
Figure 3.
The 95% bound curve (closed circles) gives the absolute error in envelope coherence for which 95% of the simulated coherences deviate by that amount or less from the coherence predicted by Eq. 7. The mean curve (open circles) gives the mean absolute error relative to Eq. 7 for simulated envelope coherences. Both curves are third-order polynomials fitted to the absolute errors of the binned data.

