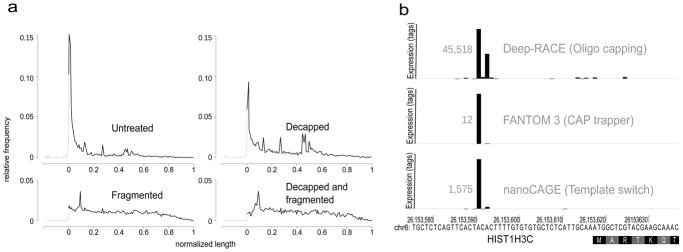
Figure 2. nanoCAGE specifically captures capped 5′ ends.
(a) nanoCAGE detects 5′ ends of capped RNA molecules. The relative frequency of CAGE tags over all RefSeq transcript models was plotted on a compound scale going from 500 bp to the start of the RefSeq (in gray) and then from 0% to 100% of the RefSeq (in black). Decapping a sample results in decreasing the prevalence of tags representing the 5′ end. Combination of decapping and fragmentation completely abolishes the detection of 5′ ends.
(b) Three independent methods of 5′ end capture, respectively based on oligo-capping, CAP trapper and template switching, detect same 5′ ends as exemplified here for the histone gene HIST1H3C, represented on a horizontal axis. The RefSeq model starts with the coding sequence at position 26,153,618 of the chromosome 6. TSSs are represented by vertical bars proportional to the number of tags they contain. The size of the highest bar is normalized for all three experiments and its expression value is written in gray at its left side.

